DOT Trade Insight Retrospective
$DOT/USD had seen a steady increase in trading volume in the two weeks preceding the entry of the trade insight. and the subsequent positive price action led to the 20D SMMA beginning to turn up. Further, $DOT was showing a more significant negative divergence from the 200D SMA than most other assets in the space.
Trigger for entry was a close above $18.75, which was met on August 4th. Goal for exit was marked at the 200D SMA at $26.75.
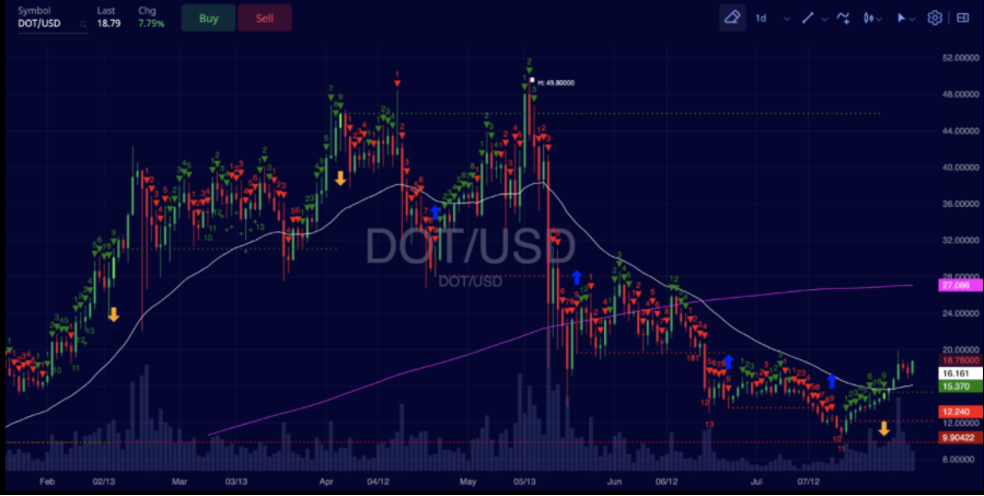
From that point, $DOT rallied to find parity with its 200D SMA and in a matter of only 15 days the exit target was hit. In hindsight, it moving average divergence was a great indication that $DOT was oversold relative to the rest of the crypto market, and the uptick in volume was a clue that we had bottomed around $10.
SRM Trade Insight Retrospective
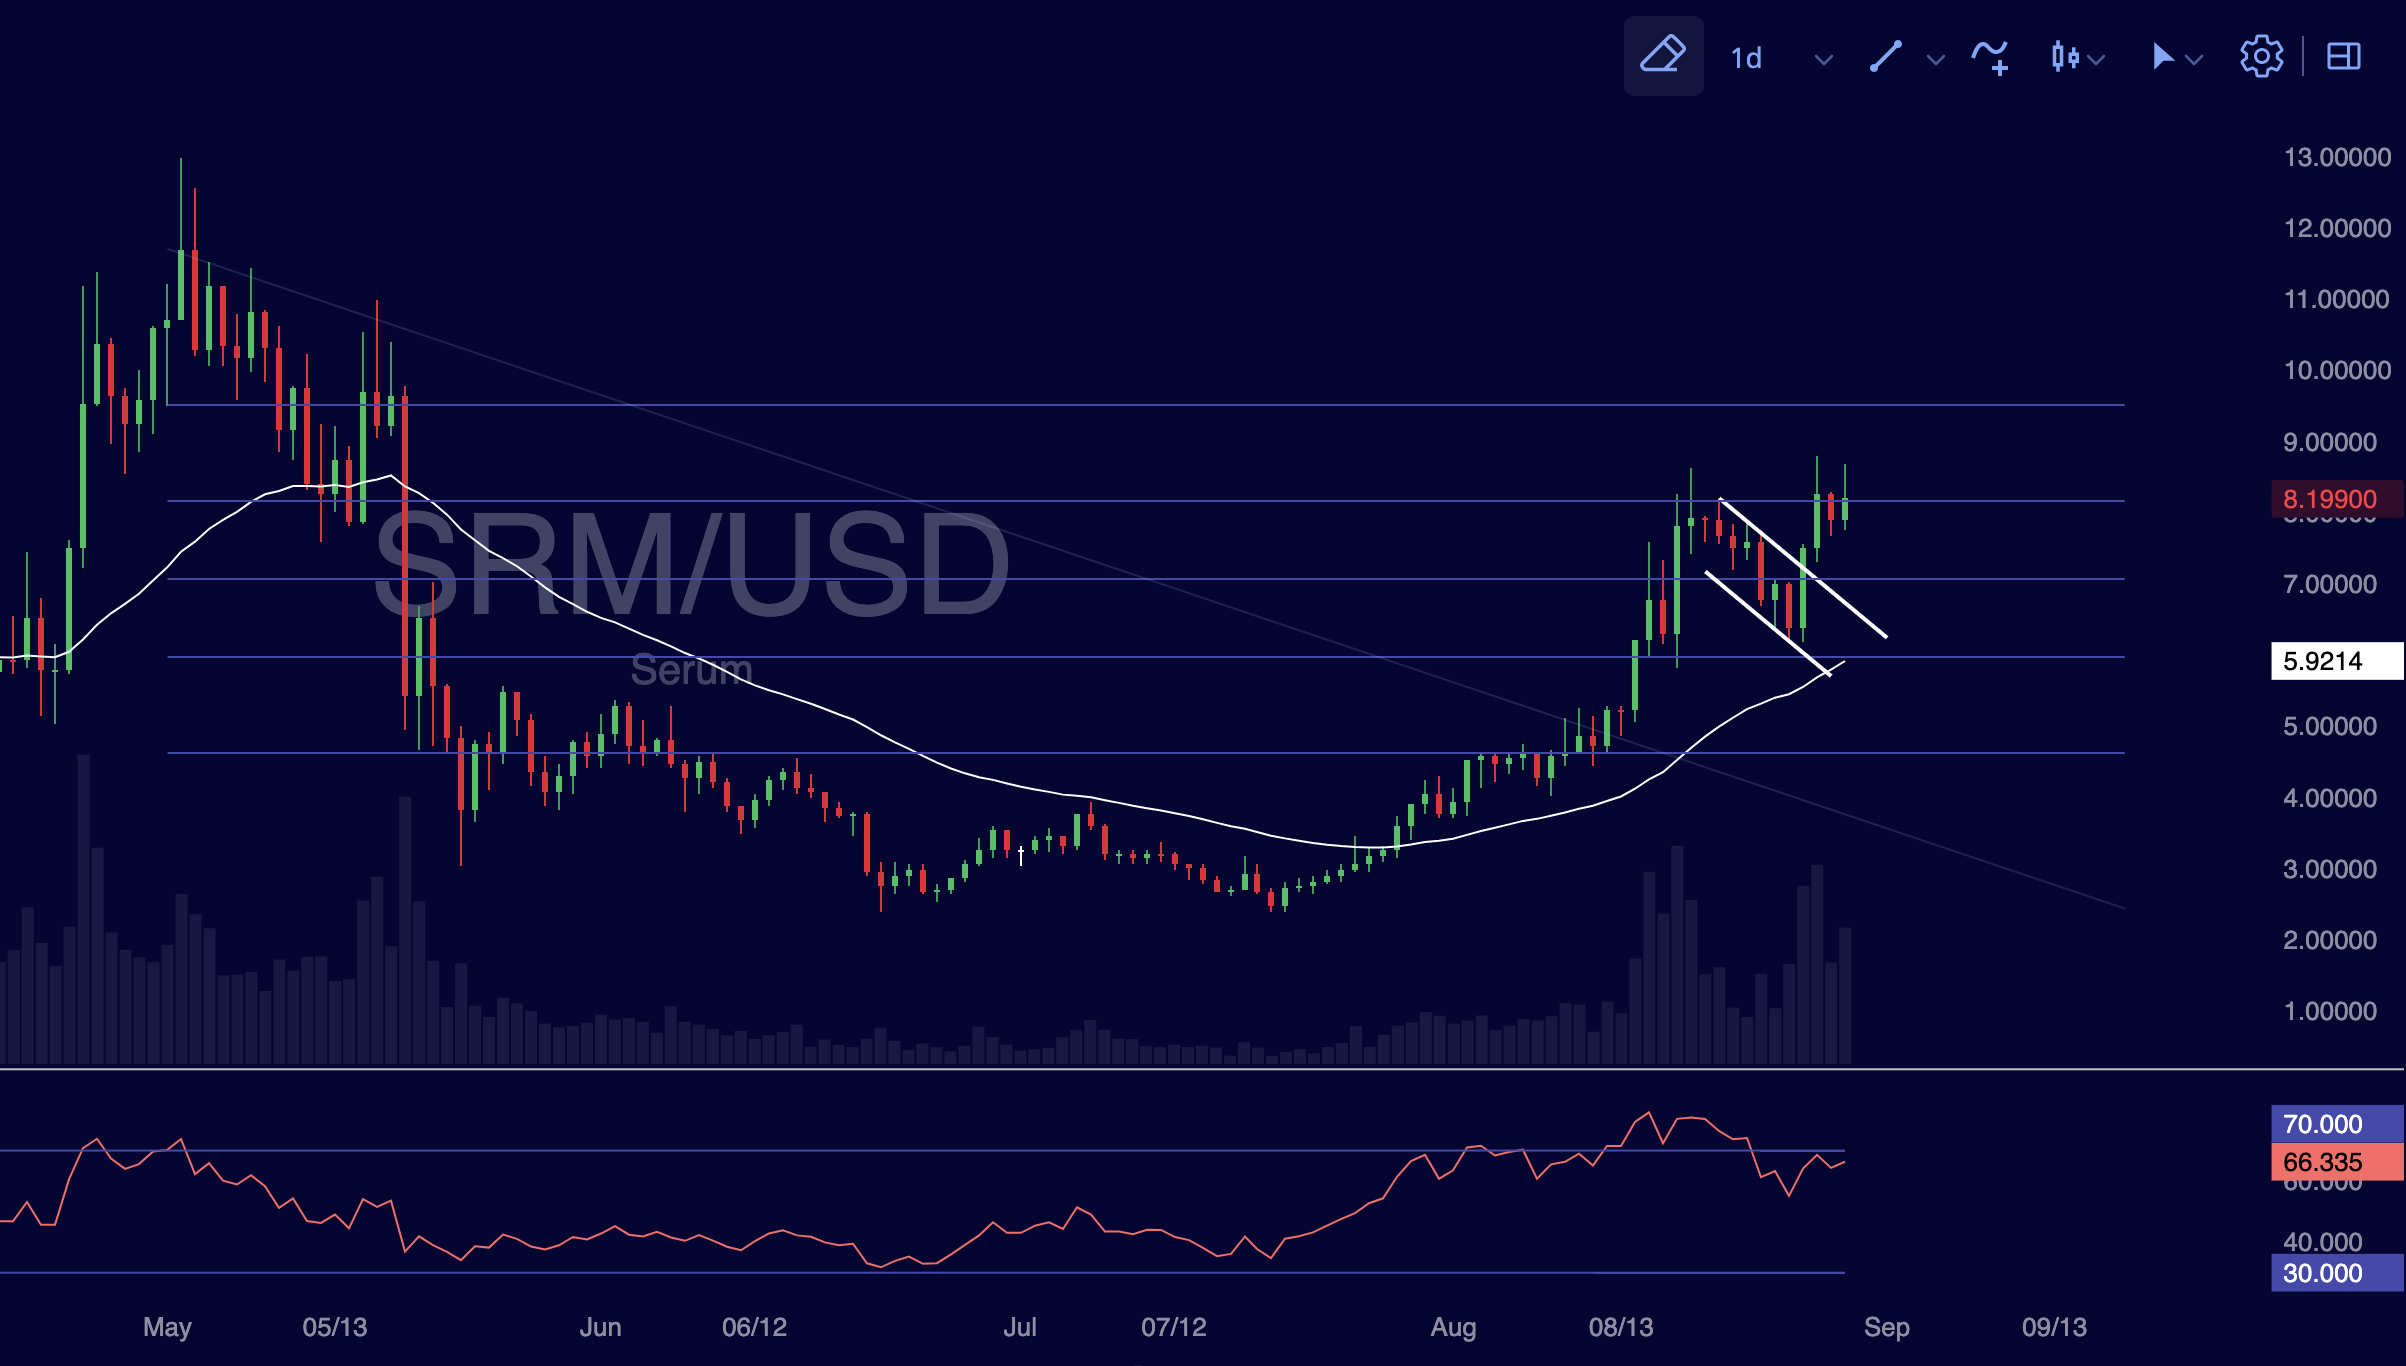
We selected SRM as a trade insight because it was forming a bullish cup and handle pattern. More importantly, SRM is the primary decentralized exchange within the Solana ecosystem. At the time of writing, SOL was showing the greatest strength of any crypto asset. Therefore, we looked for assets within the ecosystem with favorable technical setups.

We entered a long trade with a close above the trigger level of 8.27.
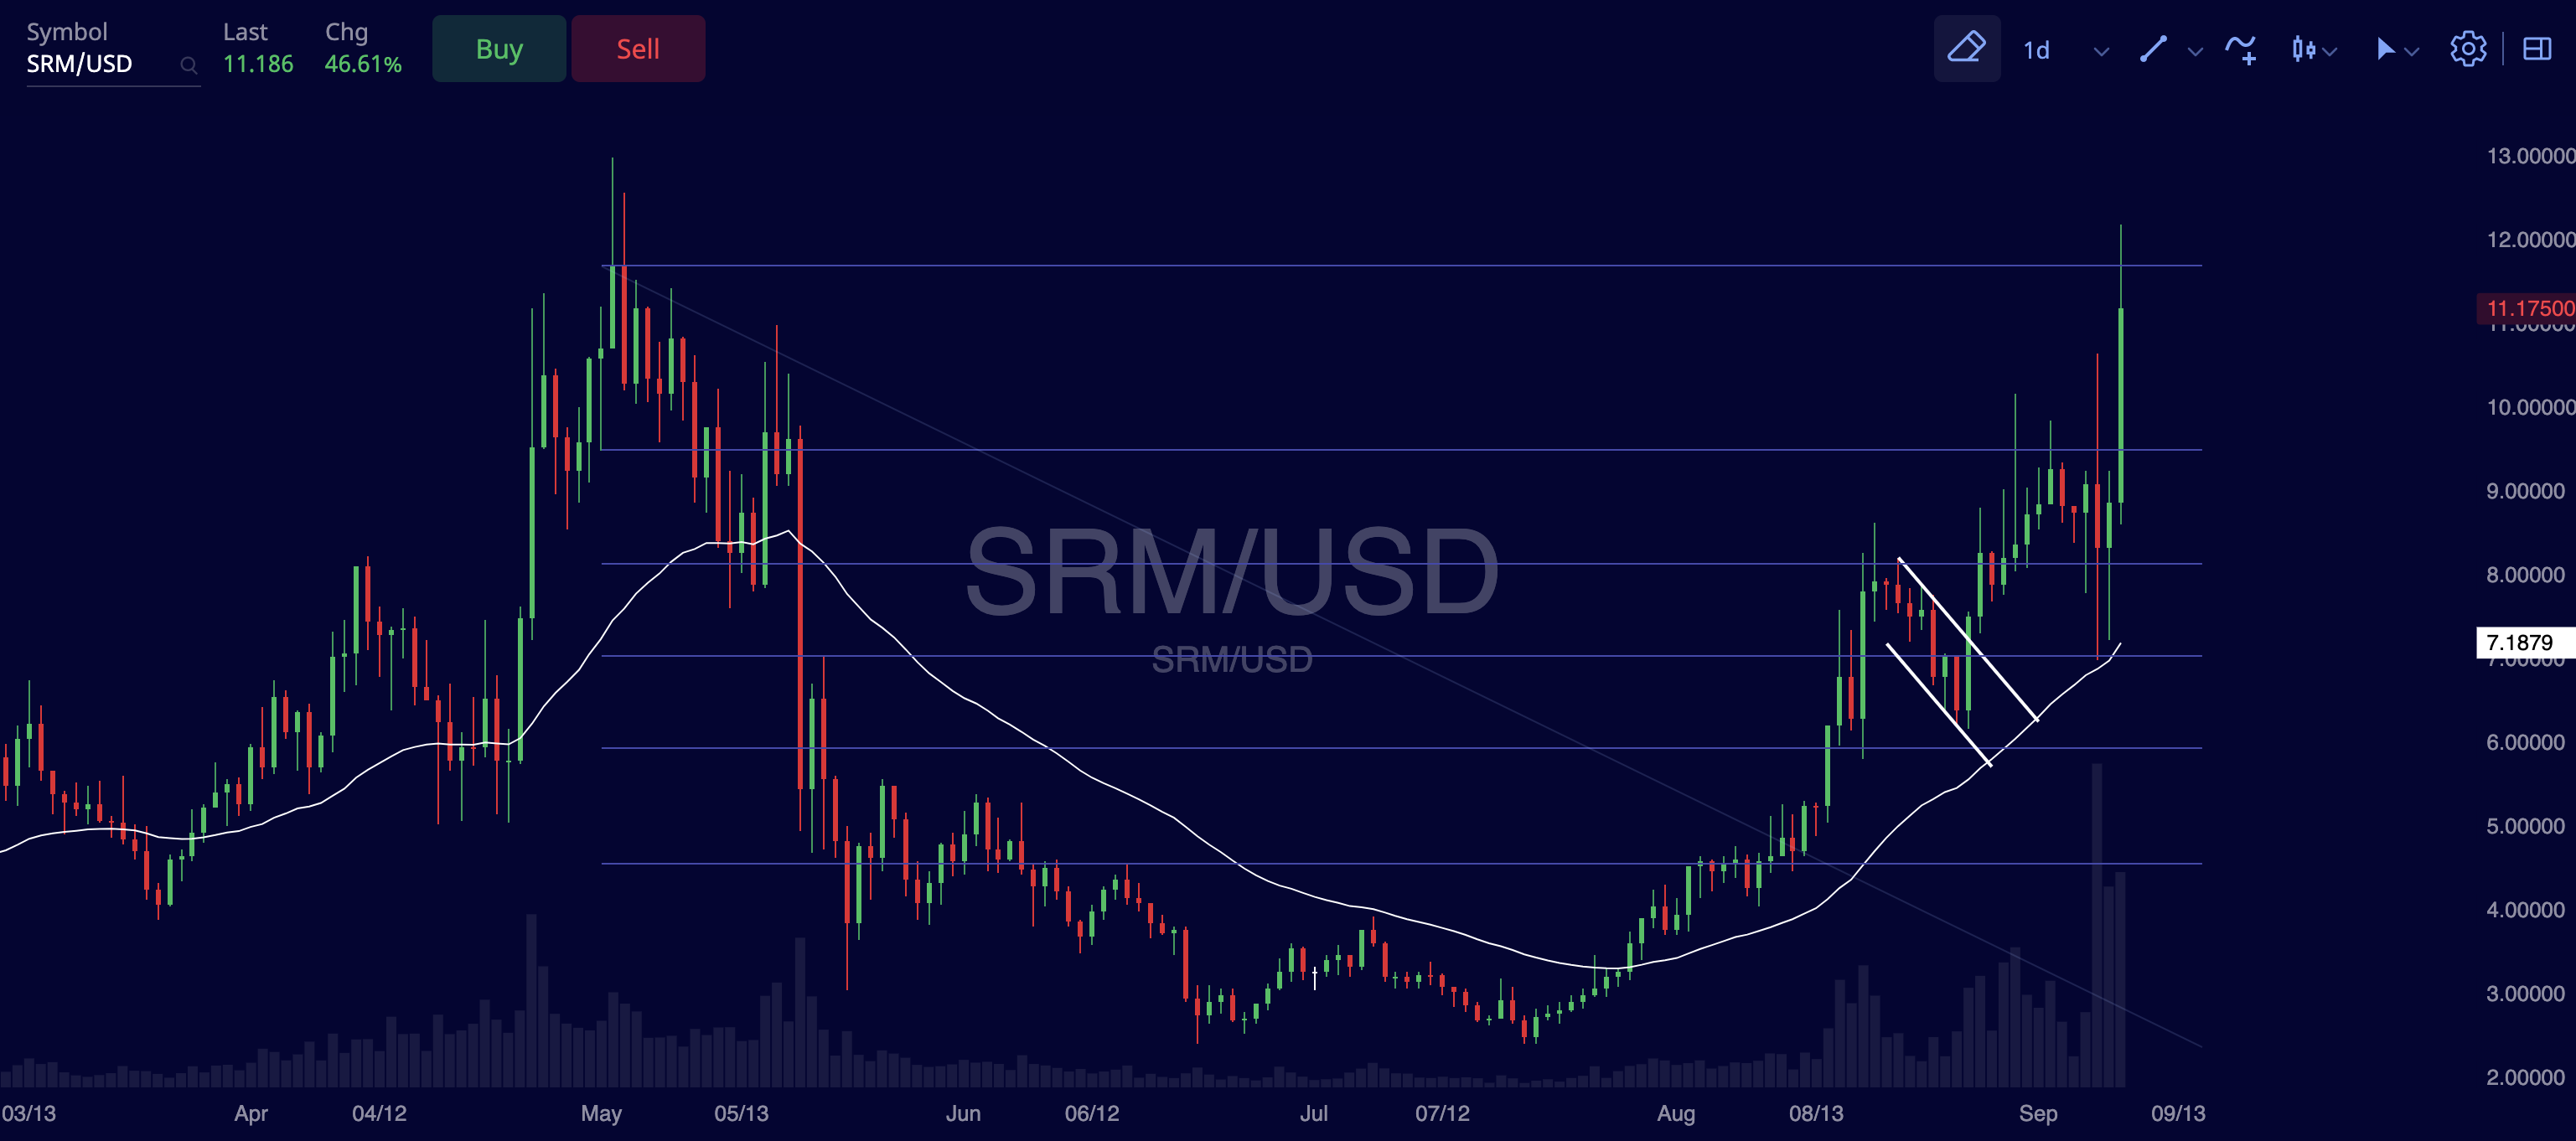
After a few days of neutral chop, price moved roughly 40% to the upside. At this point, we decided to take profit at the previous all-time high at roughly $11-12. While we are still bullish on SRM in the long-term, we found this interim move to be a good opportunity to mitigate risk if Bitcoin and the collective market retested the prior lows at $42k.